Dubai Rental Demand by Area, Decoded
I assess Dubai rental demand by area through Q3 2026 contract data, comparable leases, unit fit, affordability and upcoming supply—not citywide headlines.
Updated 22 November 2026

You evaluate Dubai rental demand by area by testing a specific property against signed contracts and verifiable renewals rather than citywide population growth. High transaction volume does not guarantee pricing power. According to ESPACE Q3 2026 data, Jumeirah Village Circle recorded 9,160 rental contracts, an 11% increase, yet average annual rents fell by 3%.
For buyers making acquisition decisions in 2027, relying on broad developer projections exposes capital to risk. You must use the latest 2026 data to model realistic holding costs and upcoming supply. This article demonstrates how to isolate unit-specific lease evidence, measure competing handovers, and calculate the actual net yield you will receive.
Citywide Growth Fails to Answer Area Questions
Broad demographic trends provide context, but they do not establish the achievable rent for a designated bedroom type in a given building. The official Digital Dubai population data recorded 4.580 million residents at the end of 2025, representing a 7.5% year-on-year increase. A growing population indicates sustained regional appeal. A remote buyer might look at that 7.5% figure and assume every neighbourhood in Dubai will experience a corresponding surge in rental pricing power.
That interpretation misreads how real estate markets absorb new residents. Population growth distributes unevenly across income bands and household sizes, as well as geographic preferences. A surge in new residents might bypass a premium waterfront community if those incoming professionals require mid-market housing near inland commercial districts. If a developer uses a citywide growth statistic to justify a high expected yield on a luxury off-plan apartment, they are substituting macroeconomics for micro-level due diligence.
I advise non-resident Indian and diaspora buyers to separate the city’s overall trajectory from the individual asset. You purchase a single title deed in a single project surrounded by specific competitors, rather than buying the Dubai average. The tenant who will pay your rent does not care about the total population count. They care about their commute and their access to schools. They also evaluate the quality of the building management and whether the apartment next door offers a better layout for less money. If you cannot identify a plausible tenant profile for the specific unit you intend to buy, the citywide population growth will not protect you from extended void periods.

Q3 2026 Area Evidence and Its Limitations
To understand current market behaviour, we must look at recent completed transaction data. The evidence cut-off for this analysis is 21 November 2026, relying on Q3 2026 as the latest fully documented quarter. A review of ESPACE real estate market data highlights a divergence between the volume of rental activity and the direction of average prices across different communities. The report labels its wider rental-activity series as sourced from Property Monitor.
The table below pairs total rental contracts and their year-on-year percentage change with the average annual rent and its corresponding change.
Apartment community | Rental contracts, Q3 2026 | Change year on year | Average annual rent, Q3 2026 | Change year on year |
|---|---|---|---|---|
Jumeirah Village Circle (JVC) | 9,160 | +11% | AED 67,912 | -3% |
Business Bay | 5,708 | +18% | AED 99,746 | -7% |
Dubai Marina | 4,396 | +10% | AED 120,382 | -8% |
Downtown Dubai | 2,884 | +9% | AED 162,317 | -9% |
Jumeirah Lake Towers (JLT) | 2,534 | +7% | AED 91,648 | -5% |
Dubai Creek Harbour | 2,025 | +23% | AED 133,799 | -6% |
Palm Jumeirah | 1,132 | +4% | AED 236,569 | +3% |
This data requires interpretation. Across Dubai residential property, the same source recorded 171,038 rental contracts in Q3 2026, which remained broadly unchanged year on year. However, the composition shifted. The market saw 77,397 new contracts, representing an 18% increase, alongside 93,641 renewals, an 11% decrease. Contract volume and average rent often move in different directions.
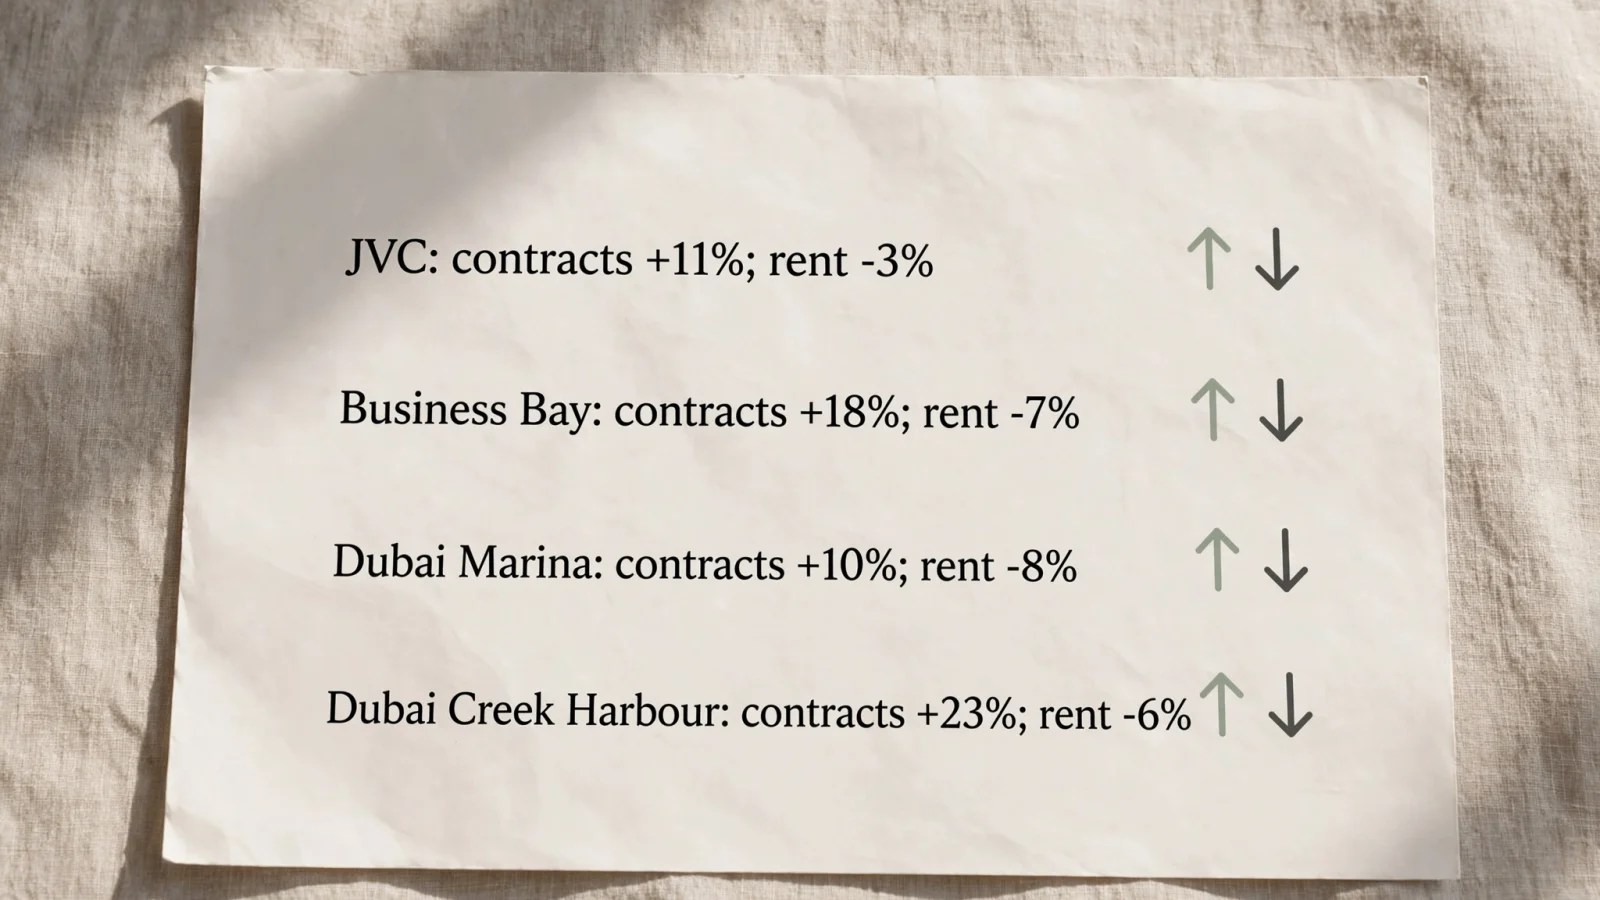
Jumeirah Village Circle recorded the highest contract count in the apartment table, yet the average rent fell by 3%. Business Bay saw an 18% increase in contract activity, but average rents dropped by 7%. Buy properties in Dubai Marina or similar established locations, and you will see a similar pattern. Marina contracts rose 10% while the average rent softened by 8%. Dubai Creek Harbour provides another example, showing a 23% jump in contracts alongside a 6% decline in average pricing.
The villa and townhouse segment operates under different dynamics and cannot be compared as if it were a like-for-like asset class. In the same Q3 period, Arabian Ranches 3 recorded 667 contracts, up 68% year on year, with an average annual rent of AED 195,261, representing a 7% increase. Dubai Hills Estate saw 653 contracts, up 5%, with the average rent climbing 7% to AED 424,805. The Springs recorded 620 contracts, marking a 1% decline, with average rents up 2% to AED 203,517.
High contract volume proves liquidity, meaning units find tenants. It does not signal pricing power. When a community sees a spike in new contracts but a drop in average rent, it often points to new supply entering the market and forcing landlords to adjust prices to secure occupancy. Furthermore, an area average rent is not a bedroom-adjusted metric. A shift in the community average could reflect more studios and one-bedroom units being leased compared to larger, more expensive three-bedroom apartments. These figures do not establish a building's occupancy rate or provide a time-to-let timeframe. They also cannot replace the need to evaluate the exact unit type you plan to acquire.
Match the Specific Unit to a Plausible Tenant
A successful rental strategy begins by defining the likely tenant as a testable hypothesis. I do not accept vague assertions that a sprawling community is universally suited for young professionals or tailored for families. The sources reviewed do not establish exact tenant nationalities and verified occupations, nor do they detail precise household sizes for these districts. Instead of adopting generic demographic labels, a remote buyer must evaluate the physical reality of the asset.
Start with the fundamental attributes. Record the expected rent band, the number of bedrooms, and the floor plan. You should also assess the level of natural light, the condition of the furnishings, and the allocation of parking spaces. Note the walking distance to public transport and the driving time to major employment hubs. Then ask which specific renter would choose this home over a cheaper alternative two streets away.
Consider a two-bedroom apartment in a high-rise development. If the unit features a closed kitchen and a maid's room, it targets a different renter pool than an open-plan two-bedroom unit with a large entertaining terrace but limited storage. A tenant prioritising a short walk to the Metro will accept a smaller living area. A tenant who drives to Abu Dhabi daily will prioritise immediate highway access and covered parking over proximity to a rail station.
Two properties sitting in the same community can face different rental prospects. One might overlook a quiet park and feature upgraded bathrooms, appealing to a long-term corporate tenant willing to pay a premium. The other, located directly above a noisy retail podium with an awkward, angled living room, might suffer months of vacancy unless the price drops below the community average. My advisory practice structures this assessment around strict physical and locational variables. This ensures the overseas investor stops buying a postcode and starts buying a functional, competitive product.
Test Rent Against Registered Leases and Alternatives
Relying on asking rents advertised on property portals exposes an investor to risk. Advertised prices represent a landlord's ambition rather than the market's reality. To protect capital, I prioritise recent signed lease evidence.
I use the Dubai Land Department Real Estate Data portal, which provides transparent access to rental records. Its rental data lists registration dates, start and end dates, area, annual amounts, property sizes and types, number of rooms, and project names. When I advise a client, I use these fields to compare leases by area, project, property type, size and room count.
The process requires matching the bedroom count and the approximate square footage. A 700-square-foot one-bedroom unit cannot be priced using the lease data of a 1,000-square-foot one-bedroom unit with a study, even if they share the same elevator bank. Where the portal's classification permits, I distinguish new contracts from renewals, as renewals often sit below open-market rates due to regulatory caps. You must verify the definition of fields labelled 'Version' rather than guessing their meaning, ensuring the data pulled reflects recent open-market activity.
Once the comparable signed leases are isolated, compare them against the target rent presented by a developer or a seller. An off-plan developer might project an annual income of AED 120,000 for a one-bedroom apartment. If the DLD records show identical completed units in the adjacent tower signing at AED 95,000, the projection is unsafe. An area average cannot act as an affordability measure or a substitute for a bedroom-adjusted comparable.
Overseas buyers face a distinct disadvantage here. Sitting in London or Singapore, they lack the local context to know if two buildings separated by a single road cater to different tenant demographics. I help remote buyers assemble dated, unit-type-specific comparisons. We question every rent estimate against the strongest available evidence. My approach means I highlight the negative comparables alongside the positive ones, bringing reality to the financial model without promising an unachievable letting outcome.
Check Project Handovers Before Accepting a Rent Forecast
Current lease data only indicates past performance. To understand what will happen during your holding period, you must measure upcoming competition. A high current rent holds no value if it collapses as your property reaches the market.
I use the DLD project records to screen for nearby developments with overlapping unit types and delivery periods. The official data includes the area, project name, current status, and completion percentage, alongside the expected completion date and total number of units. You must distinguish between planned units and completed homes that are available to rent. A project sitting at 40% completion will not threaten your rental yield this year. However, a neighbouring tower at 95% completion will inject immediate supply into your micro-market upon handover.
Consider the data from the earlier table. Emaar Dubai Creek Harbour recorded a 23% increase in rental contracts alongside a 6% drop in average rent. This dynamic acts as a signal to check comparable completed stock. When hundreds of new apartments hand over simultaneously in a concentrated area, landlords often undercut each other to secure the first wave of available tenants. This behaviour drives down the average rent despite high transaction volume. The data does not prove that handovers caused the softer rents without unit-level verification, but it provides a reason to investigate the local pipeline.
If you are buying an investment property, map out every competing tower due for completion within twelve months of your target lease date. If the market is about to absorb 800 new apartments with the same bedroom count and similar amenities, your pricing power will diminish. Show the downside scenario in your spreadsheet. Account for the fact that a tenant might cross the street to rent a brand-new apartment rather than paying premium pricing for your five-year-old unit.
Use the DLD Rental Index for Renewal Context
I refer to official regulatory tools to understand how rent changes for an existing tenant. The Dubai Land Department launched the Smart Rental Index 2025 on 2 January 2025. The index provides landlords and tenants with a structured framework for rental increases in Dubai, with percentages based on the difference between current rent and average market rent.
According to the official guidelines, the residential index utilises building classifications and incorporates factors such as construction quality and available services, along with location. The DLD states that the index is updated annually. New buildings are added only after they are registered in the DLD system.
The index operates on a specific calculation scale. A landlord cannot raise the rent by any amount they choose. The permitted rental-increase scale ranges from 0% to 20%, determined by the percentage difference between the tenant's current rent and the defined average market rent for that unit type. If a tenant is already paying close to the market average, the permitted increase will be zero. The index excludes properties located within the Dubai International Financial Centre (DIFC), which operates under its own legal and regulatory framework.
I advise clients to use the RERA Rental Index Dubai Calculator exclusively as a reference for checking a renewal scenario. It serves as a regulatory ceiling rather than a growth forecast. You cannot use the index to predict what a new tenant will pay on the open market, nor does it guarantee that an existing tenant will accept the maximum permitted increase without moving out. When building an investment model, factor in the renewal caps to understand the long-term trajectory of your income, but never treat the top edge of the index band as a guaranteed outcome.

Build a Net Case Around Your Holding Period
A professional assessment of Dubai rental demand by area must culminate in a tailored financial model. Gross rent is a vanity metric. The primary number that matters to an international investor is the net cash flow generated after all holding costs are settled.
I build the income case starting from a conservative, unit-specific rent assumption supported by signed DLD lease data, rather than developer brochures. From this baseline, I deduct every applicable cost. First, subtract the annual service charges, which are calculated per square foot and can impact the yield of larger apartments. Next, deduct management and leasing agency fees, ensuring you account for applicable VAT. Include a dedicated provision for ongoing maintenance, even for new buildings. If the unit is leased furnished, amortise the cost of replacing the furniture over a sensible lifecycle.
An investor must also model vacancy and re-letting time. Tenants move, and properties sit empty while waiting for repainting and deep cleaning, as well as a new contract signature. Assuming 100% occupancy over a five-year period is financially reckless. I model a downside case that includes a lower baseline rent, a longer void period between tenancies, and the verified impact of competing supply handovers. If the buyer is utilising a mortgage, financing costs must be separated from the operational yield to show the return on deployed equity.
This entire model must tie directly to your personal holding period and your need for capital liquidity, alongside your risk tolerance. The calculation for a ready property differs from an off-plan acquisition. A ready property generates income immediately, allowing you to test the current market reality. An off-plan property requires you to deploy capital now, with rental income only commencing after handover. That handover may be delayed, entering a market environment that could look different from today. If the downside model fails to meet your financial thresholds, Dubai real estate price drop forecasts and historical resilience data become relevant context for deciding whether to proceed or walk away.
Remote buyers should demand a strict evidence checklist before transferring funds. You need:
- Dated, building-specific, and unit-type-specific lease comparisons.
- A physical match between the test data and the target unit.
- Fully documented owner costs, including verified past service charges.
- Official project status and completion evidence for surrounding plots.
- Written rent assumptions detailing both the expected and downside scenarios.
My advisory work brings these checks together under the five-point ADVICEdge framework: alignment with your core objectives, depth of analytical research, a clear voice, integrity regarding market risks, and compassion for the stress of managing capital across borders. The objective is to apply professional scrutiny to every projected return and prevent expensive mistakes.
Demand functions as a shifting relationship between a specific physical asset, its precise running costs, and the changing pool of tenants who can afford it. You must evaluate the unit and verify the costs while modelling the downside, letting the evidence dictate your final decision.
Book a no-obligation intro call with Ritu Kant Ojha Real Estate Advisory to review your target property and holding strategy.
Ask Ritu Kant
Have a question about your purchase? Ask me directly.
Tell me what you are considering. I read every message myself and reply within one working day.